Architecture graph
Reached with n → o in the sessions menu, or the Graph project tab in the GUI.
An interactive, whole-project dependency graph rendered as a self-contained HTML (no CDN), opened in your browser.
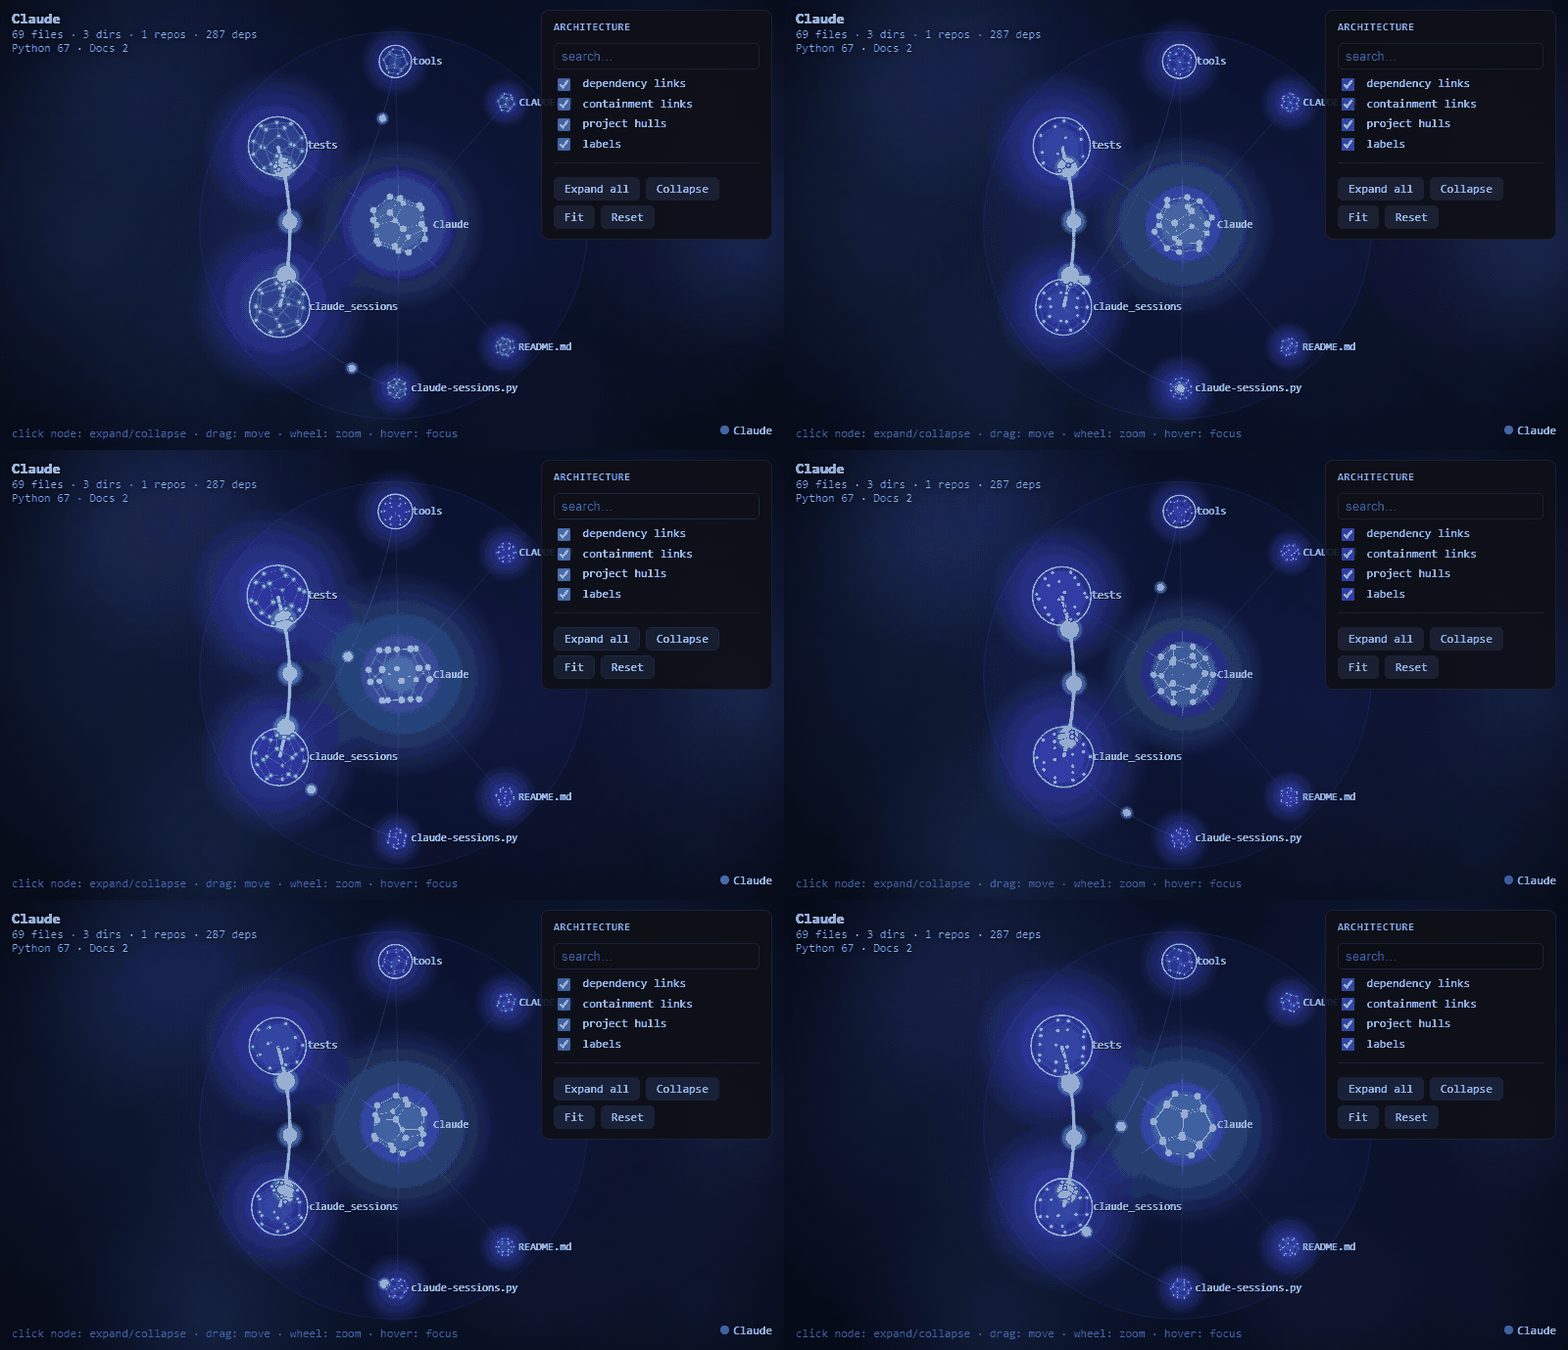
- Expandable hierarchy — opens at the workspace root + its repos (sized by importance); click a node to drill in (repo → module → file) with a smooth opening animation. The complete tree is embedded, so any size is explorable via progressive disclosure; small projects auto-expand fully.
- Real dependencies, multi-language — edges come from actual imports: Python
import(AST) + C/C++#include+ C#using→namespace + JS/TSimport/require. Edges lift to the visible level: collapsed shows repo↔repo bundles, expanded reveals module- and file-level links. - Reads as architecture — each project sits in its own contained bubble (never overlaps others), nodes sized by importance (file count + dependency degree), colored per project, animated rotating dodecahedra with flowing connection particles on a neural-network-style canvas.
- Controls — search (expands the path to matches), filters (dependency / containment / hulls / labels), Fit / Reset / Expand-all / Collapse; zoom-aware labels; hover highlights neighbors. Built graph is cached (
.claudectl/connections-cache.json) so reopening is instant;rforces a rebuild.
The animation above is captured from the real HTML view (docs/graph-real.gif, regenerate
with py tools/capture_graph_gif.py).
The same dependency edges and importance ranks feed project memory and adaptive agent selection — the graph is not a separate analysis, it is the one claudectl already runs.